---
title: "Resumen de las observaciones de la iniciativa NeoMapas en iNaturalist"
author: "José R. Ferrer-Paris"
date: "2025-07-23"
date-modified: last-modified
categories: [R, rinat, Español, plotly, ggplot2, tmap, Venezuela]
output: html_document
editor_options:
chunk_output_type: console
execute:
echo: true
message: true
warning: true
format:
html:
code-tools:
source: true
caption: "Code for this document"
image: "https://inaturalist-open-data.s3.amazonaws.com/photos/2002533/medium.jpg"
image-alt: "(c) JR Ferrer-Paris, some rights reserved (CC BY)"
lang: es
---
En este documento muestro un resumen de las observaciones realizadas en iNaturalist durante mis años de trabajo en la iniciativa NeoMapas.
## Cargar paquetes
```{r setup}
library(ggplot2)
library(rinat)
library(dataverse)
library(tmap)
library(DT)
library(sf)
library(plotly)
library(stringr)
library(lubridate)
library(dplyr)
```
## Leer datos de iNaturalist
```{r}
here::i_am("projects/NeoMapas-dashboard.qmd")
if (!dir.exists(here::here("data")))
    dir.create(here::here("data"))
inat_obs_data <- here::here("data", "inat-obs.rds")
if (file.exists(inat_obs_data)) {
    user_obs <- readRDS(inat_obs_data)
} else {
    user_obs <- get_inat_obs_user("NeoMapas",maxresults = 5000) |>
        mutate(dts=date(datetime), year=year(dts), month=month(dts))
    saveRDS(user_obs, inat_obs_data)
}
```
## Leer datos espaciales de la iniciativa NeoMapas
```{r}
dest_file <- tempfile(fileext=".gpkg")
binary_file <- get_file_by_name(filename="VBG.gpkg",dataset="10.7910/DVN/IME0M5")
writeBin(binary_file, dest_file)
CNEB <- read_sf(dest_file)
```
## Preparar los datos
```{r}
lookup <- c(name="scientific_name",
            user="user_login",
            #date="observed_on",
            taxonid="id",
            taxon="iconic_taxon_name",
            kingdom="taxon_kingdom_name",
            phylum="taxon_phylum_name",
            class="taxon_class_name",
            order="taxon_order_name",
            genus="taxon_genus_name"
            )

NeoMapas_obs <- user_obs |>
    mutate(date=ymd(observed_on),
        filter1 = grepl("Muestreos de NeoMapas", tag_list),
        URA=str_extract(tag_list,"NM[0-9]+")) |>
  rename(any_of(lookup)) |>
  filter(
    latitude > 0 &
    latitude <13 &
    longitude < -60 &
    longitude > -80) |>
    filter(filter1 | year(date) %in% 2003:2012) |>
    st_as_sf(coords=c("longitude","latitude"), crs=4326)
```
```{r}
qry <- st_intersects(NeoMapas_obs,CNEB)

NeoMapas_obs[lengths(qry)==1,"CN"] <- {CNEB |> slice(unlist(qry)) |> pull(cdg)}

NeoMapas_obs <- NeoMapas_obs |>
  mutate(unidad=case_when(
    !is.na(URA) & !is.na(CN) ~ sprintf("%s (%s)",URA,CN),
    !is.na(CN) ~ sprintf("celda %s",CN),
    TRUE ~ "sin información"))


obs_byyear <-  as.data.frame(table(year(NeoMapas_obs$date)))

colnames(obs_byyear) <- c("Año","Observaciones")
```
## Dimensión espacial
### Unidades regionales de NeoMapas
```{r uralist}
NeoMapas_obs |>
  st_drop_geometry() |>
  group_by("Unidades regionales"=unidad) |>
  summarise(Observaciones=n_distinct(date), Registros=n()) |>
  arrange(desc(Observaciones)) |>
  DT::datatable(style="bootstrap")
```
### Lugares
```{r sitelist}
NeoMapas_obs |>
  st_drop_geometry() |>
  group_by("Lugar"=place_guess) |>
  summarise(Observaciones=n_distinct(date), Registros=n()) |>
  arrange(desc(Observaciones)) |>
  DT::datatable(style="bootstrap")
```
### Mapa
```{r map, eval = TRUE}
popup_html <- with(NeoMapas_obs,
                   sprintf("<p><b>%s</b><br/><i>%s</i></p>
                           <p>Observada en <u>%s</u> el %s<br/>
                           <p>
                           <img src='%s' width='200'/><br/>
                           <a href='%s' target='inat'>Ver en iNaturalist</a>
                           </p>",
                           common_name,  name, unidad,
                           date, image_url,url))

#tmap_mode("view")
CNEB_slc <- CNEB |>
    filter(UM>0) |>
    select(celda=cdg)

map1 <- tm_shape(CNEB_slc) +
  tm_polygons(fill_alpha=.33) +
  tm_minimap()

tmap_leaflet(map1) |> leaflet::addMarkers(data = NeoMapas_obs,
                   popup = ~popup_html)
```
## Dimensión taxonómica
### Observaciones por Phylum
```{r donut}
taxranks = as.data.frame(table(NeoMapas_obs$taxon))
p = taxranks |> plot_ly(labels = ~Var1, values=~Freq) |>
  add_pie(hole=0.6) |>
  layout(title = ~paste0("Numero total de Taxa: ", length(unique(NeoMapas_obs$taxonid))))

plotly::config(p,displayModeBar = F)
```
### Especies
```{r taxalist}
NeoMapas_obs |>
  st_drop_geometry() |>
  group_by("Especies"=name) |>
  summarise(Observaciones=n_distinct(date), Registros=n()) |>
  arrange(desc(Observaciones)) |>
  DT::datatable(style="bootstrap")
```
## Observaciones en el tiempo
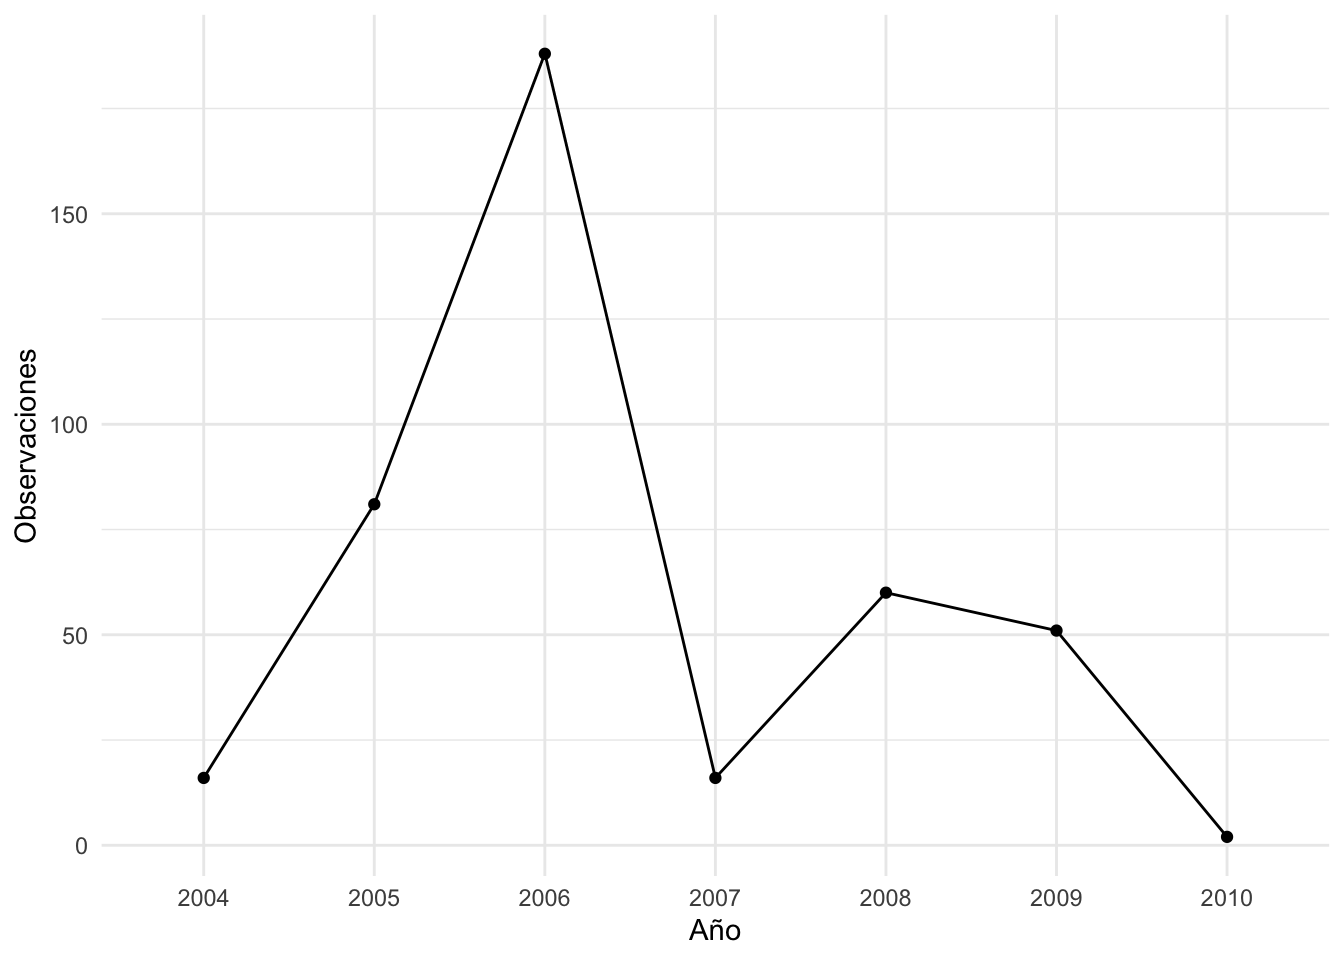
### Observaciones por año
```{r obsbyyear}
#plot number of observation by date
ggplot(obs_byyear, aes(x=Año,y=Observaciones,group=1)) + geom_line() + geom_point()+ xlab("Año") + ylab("Observaciones") + theme_minimal()
```
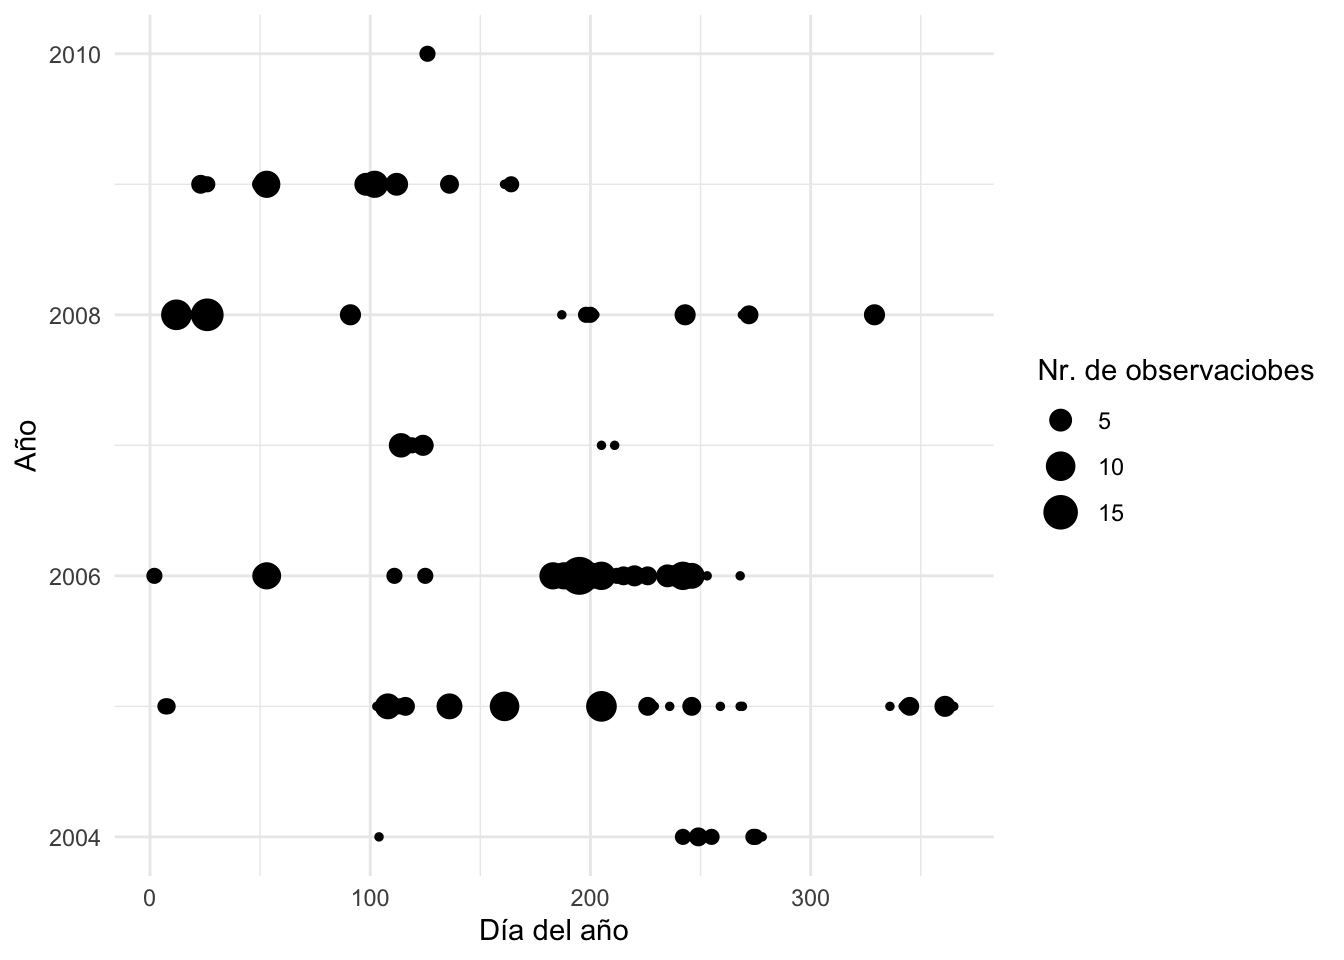
### Calendario de observaciones
```{r calobs2022}
inat_obs_day <- NeoMapas_obs |>
  transmute(obs_year=year(date),
            obs_day=yday(date)) |>
  group_by(obs_year,obs_day,.groups = "drop") |>
  summarise(Freq=n()) |>
  mutate(obs_day=as.numeric(as.character(obs_day)))
ggplot(inat_obs_day,aes(x=obs_day,y=obs_year,size=Freq)) +
  geom_point() +
  labs(x="Día del año",
       y="Año",
       size = "Nr. de observaciobes") +
  theme_minimal()
```